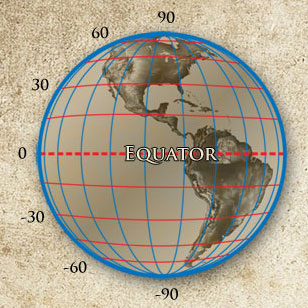
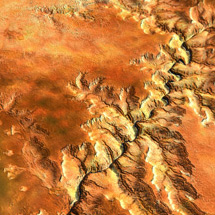
This one was a real challenge in a few ways. I needed to visualize actual terrain in 3D and show how that relates in 3D with a topological map. I scanned the map, found the shader files from GIS (to define the elevation in the 3D program), and a satellite image of the Grand Canyon to colorize it. Getting the three to align perfectly was a bunch of Photoshop scaling and nudging with transparent layers to get things just right. My eyes started to cross but the result came out just as I wanted. A simple demonstration, but I learned a little about the maps I carry with me on hiking and camping trips. Another plus of creating info graphics.
"The Patternists specialized in cerebral asymmetry. With grossly expanded right-brain hemispheres, they were highly intuitive, given to metaphors, parallels, and sudden cognitive leaps. Their inventive minds and quick, unpredictable genius had given them a competitive edge at first. But with these advantages had come grave weaknesses: autism, fugue states, and paranoia. Patternists grew out of control and became grotesque webs of fantasy." - Bruce Sterling Schismatrix Plus
Showing posts with label infographics. Show all posts
01 November 2011
16 October 2011
Some Science Illustration
I'm so into scientific illustration. These two are some simple concepts, for the wee people among us. Infographics and educational material are really interesting design problems. Seems to pull from many perceptual faculties at once. You can never talk to yourself. Always from the point of view of someone who wants to learn. Very similar process to designing any layout actually. And these days, you have to keep up a variety of aesthetics to keep visual interest. So I went pirate mappy with the map concepts. With the fossils, I wanted something more museum display. Sometimes a clean presentation is a nice background to a rather dirty old subject.
Subscribe to:
Posts (Atom)